With most investors believing that small-sized and mid-market buyout funds currently present the best opportunities in private equity, this article from Preqin Private Equity Spotlight, August 2015, examines whether the size of a buyout fund has any significant impact on returns.
According to Preqin’s latest investor survey, carried out in June 2015, over half of LPs (51 per cent) surveyed see small-sized and mid-market buyout funds as currently presenting the best opportunities in private equity. In contrast, just 10 per cent of investors believe that large-sized and mega buyout funds present the best opportunities.
Despite this investor view, private equity buyout fundraising is currently dominated by a small number of fund managers raising the majority of capital via large/mega vehicles*. Of the 191 buyout funds closed in 2014, which raised a collective USD186 billion, eight mega and 27 large-sized buyout funds accounted for 70 per cent of all capital, accumulating over USD130 billion. It is a similar story for funds in market: just six mega buyout funds from a total of 282 vehicles on the road account for 24 per cent of aggregate buyout capital sought. One fund alone represents 9 per cent of total targeted buyout capital: Blackstone Capital Partners VII came to market in November 2014 with a hard cap of USD17.5 billion.
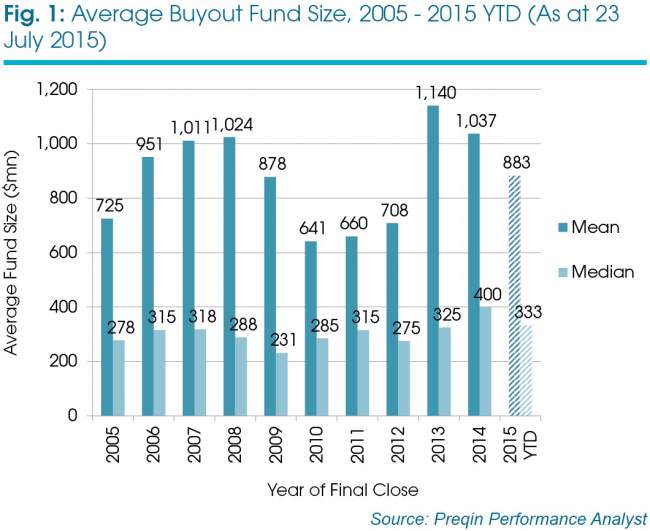
Preqin’s Funds in Market database reveals that the majority (74 per cent) of buyout funds that held a final close in 2014 are categorized by Preqin as either small-sized or mid-market*. Fig 1 shows that average buyout fund sizes have been creeping up in recent years, with the median fund size having reached its highest ever annual level (USD400 million) in 2014. Using historical data on buyout funds from Preqin’s Performance Analyst, we investigate whether investors’ preference for small-sized and mid-market buyout funds is well founded, and if these vehicles have historically outperformed larger buyout funds.
Horizon IRRs
Using Preqin’s cash flow data, we are able to calculate horizon IRRs to illustrate buyout fund performance over defined time periods to December 2014 (Fig 2). Over the one-, three- and five-year periods, the difference in horizon IRRs is relatively limited; small-sized funds performed least well over these time periods while mega funds performed best over the three- and five-year periods, with horizon IRRs of 18.6 per cent and 16.3 per cent respectively. Among funds for which we hold 10-year data, the horizon IRRs for all fund sizes reached their highest levels. However, it is small-sized buyout funds that showed the most marked improvement in performance, with a horizon IRR of 31.5 per cent, 10 percentage points higher than the next best performing fund size, mega buyouts (21.3 per cent).
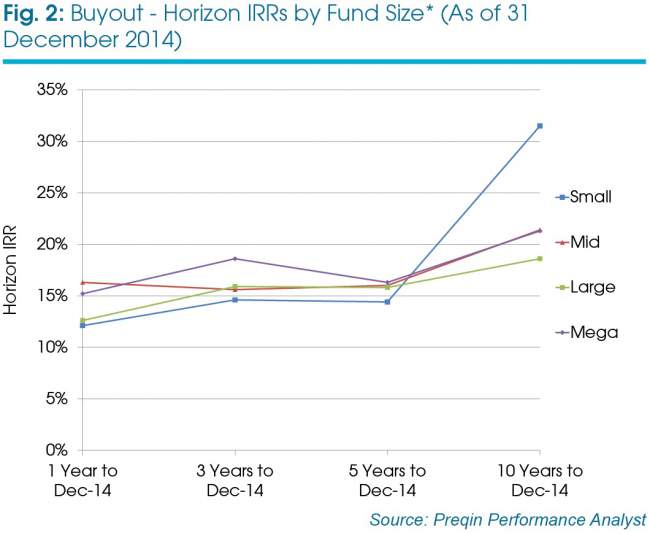
Strong performance for small-sized funds over the longer term could be attributed to the larger growth potential seen in the smaller portfolio companies that small-sized buyout funds invest in, where there is typically greater potential for fund managers to increase market penetration of acquired companies. Large-sized and mega funds tend to invest in more established, larger firms, where value add comes from restructuring and management changes, rather than market expansion. In June’s Private Equity Spotlight, it was noted that sector-specific buyout funds tend to outperform diversified vehicles. Interestingly, the proportion of small-sized buyout funds that are sector specific is much larger than that of large-sized or mega funds, with the vast majority of these larger funds taking a diversified industry approach. This may then go some way to explain the outperformance seen in the horizon IRR data for 10 years to December 2014.
PrEQIn Index
The PrEQIn Private Equity Quarterly Index captures the returns earned by investors on average in their private equity portfolios, based on the actual amount of money invested in private equity partnerships. Fig 3 shows index returns for the different buyout fund sizes since December 2004. Rebasing the index to this point in time provides not only a comparison against the 10-year horizon IRR results, but would also match many investors’ experience of the asset class. 2004 was the point at which buyout fundraising accelerated as managers looked to take advantage of low interest rates and readily available debt financing leading to the buyout boom era that reached its pinnacle in 2007.
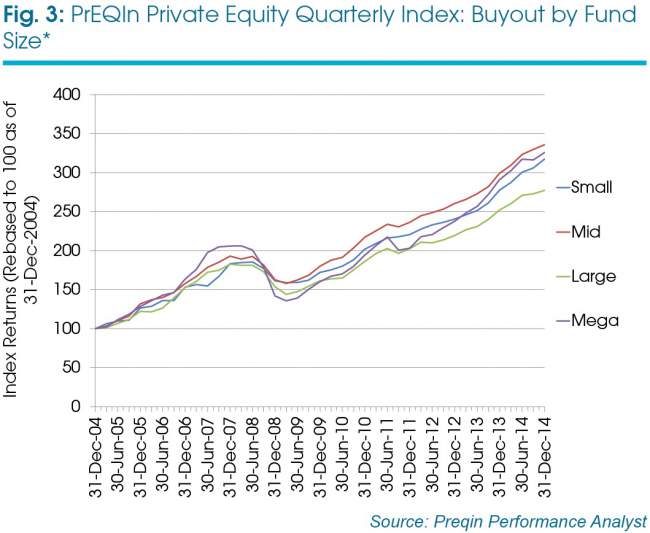
The pattern shown in Fig 3 is one of considerable variation. Between June 2009 and December 2014, mid-market buyout funds scored the highest index returns of all the fund sizes, while between December 2011 and December 2014, large buyout funds have posted the lowest index scores. Unlike the horizon IRR analysis, small-sized buyout funds only performed the best of all the fund sizes briefly in 2005 and 2009. Interestingly, we note that mega buyout funds appear to be the most affected by wider economic market conditions, posting the most volatile returns. Performing the best in the economic boom period before 2008, we see mega funds suffering the largest dip in relative performance across all fund sizes, falling sharply until the start of 2009 from 206 to 136. Over the last two to three years, however, mega fund performance has improved, posting the second highest index score of all fund sizes since March 2013.
Quartile ranking
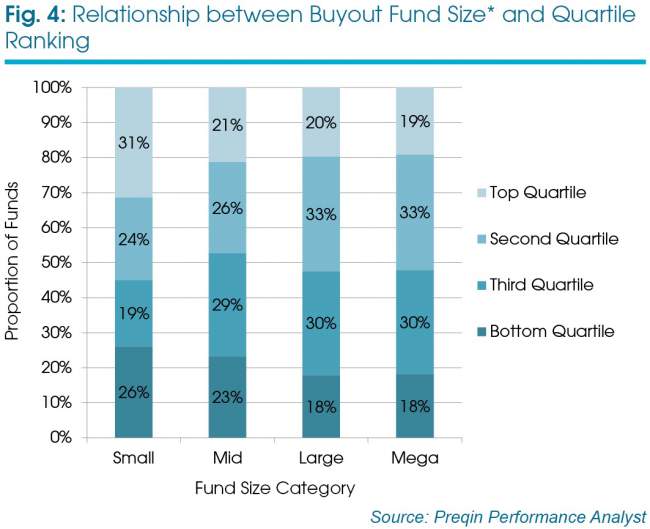
As shown in Fig 4, performance quartile rankings differ across buyout fund sizes when benchmarked against all sizes of buyout funds with the same geographic focus and vintage year. Small-sized buyout funds have by far the largest proportion (31 per cent) of vehicles ranked as top quartile, compared with just 19 per cent of mega funds. However, small-sized funds also have the greatest proportion (26 per cent) of funds in the bottom quartile than any other fund size. This indicates that despite the horizon IRR data suggesting the possibility for higher returns from small-sized buyout funds over the longer term, there is a greater chance of investing in a bottom-quartile fund compared to the other buyout fund sizes.
Risk/return
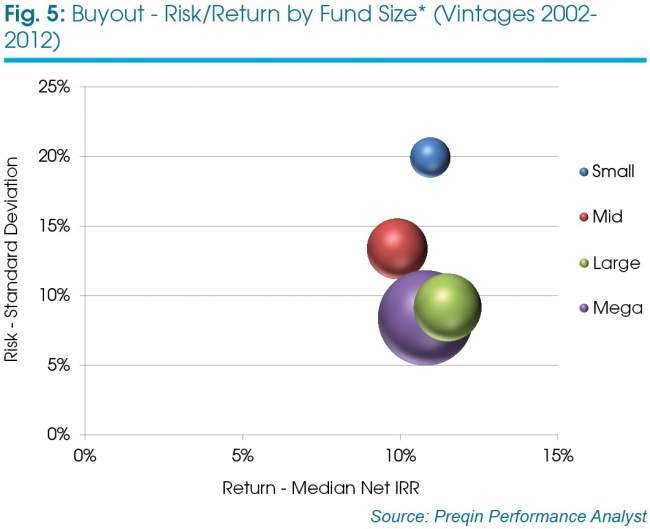
Fig 5 shows the risk/return patterns of buyout fund sizes for vintages 2002-2012. The position of each strategy is plotted by its median net IRR and associated level of risk, represented by the standard deviation of net IRR. The size of each sphere is determined by the total amount of investor commitments to that strategy. The chart shows that small-sized (19.9 per cent) and mid-market (13.4 per cent) buyout funds had a far greater standard deviation of IRR compared to large-sized (9.2 per cent) and mega funds (8.4 per cent), indicating a higher level of risk. In terms of median net IRR, there was minimal variation between the mega, small- and large-sized funds (10.8 per cent to 11.5 per cent); however, mid-market funds showed the lowest median net IRR of 9.9 per cent.
League tables
The league tables can be found in the full Spotlight and outline the most consistent performing managers across the different buyout fund sizes, categorized by average quartile rankings assigned by Preqin. Only mature funds that have meaningful performance data are included, meaning that recent vintages (2013-2015) are excluded. The tables are restricted to include only fund managers that have raised at least three buyout funds of a similar size, and include only active fund managers whereby the fund manager must have raised a similar strategy fund since 2009. To identify the most consistent performers, an average quartile rank is assigned to each manager, by assigning top-quartile funds a score of one, second-quartile funds a score of two and so on, and then taking an average of the scores.
Does size really matter?
Preqin’s analysis shows the performance of buyout vehicles indeed varies between fund size. However, using different metrics and looking across different time horizons over the past 10 years, the size groups exhibit varying levels of success. As a result, there is no clear proof to suggest that buyout funds of one size range generally outperform or underperform those of other sizes, and in particular, no evidence to support a view that small-sized and mid-market buyout funds have outperformed larger buyout vehicles.
There is some indication from the PrEQIn Private Equity Quarterly Index that mega fund performance appears to be more strongly influenced by overall market conditions. Performing the best of all buyout fund sizes in the buyout boom up until 2007, mega funds then suffered a major setback in the Global Financial Crisis, but since 2013 have seen strong performance as market conditions have improved.
Most importantly it is clear that there is greater variability in the performance of smaller fund sizes compared to larger buyout funds as indicated by a greater standard deviation of net IRR and a larger percentage of bottom-quartile funds. In fact, it is the difference between the best and most consistent firms and the weaker performers that makes the biggest difference to the returns seen by investors. There is no simple rule for investors, like “focus on smaller funds for generally better performance”. Instead, the key for investors lies in selecting the best fund managers, of any fund size, based on careful data analysis and due diligence.
This article is taken from Preqin Private Equity Spotlight, August 2015. To read the full newsletter, which also features a look at Latin America-focused fundraising, an overview of Asia-based private equity investors and more, click here.